chart maker
How to Make a Chart from Spreadsheet Data with Metricwise
You have the numbers in a spreadsheet. Now you need a chart that makes them easy to understand.
With Metricwise Chart Maker, you can paste data from Excel or Google Sheets, choose a chart type, customise the design, and download a PNG for your report or presentation. Creating and downloading charts is free, with no account required.
This guide walks through the process, from preparing your table to adding the details that help readers understand what it shows.
Start with the question your chart should answer
Before choosing colours or a chart type, decide what you want readers to learn.
A useful chart usually answers one clear question:
- Which product generated the most revenue?
- How have orders changed over time?
- What proportion of spending went to each category?
- Where do people leave the conversion funnel?
That question determines which columns you need and how to display them.
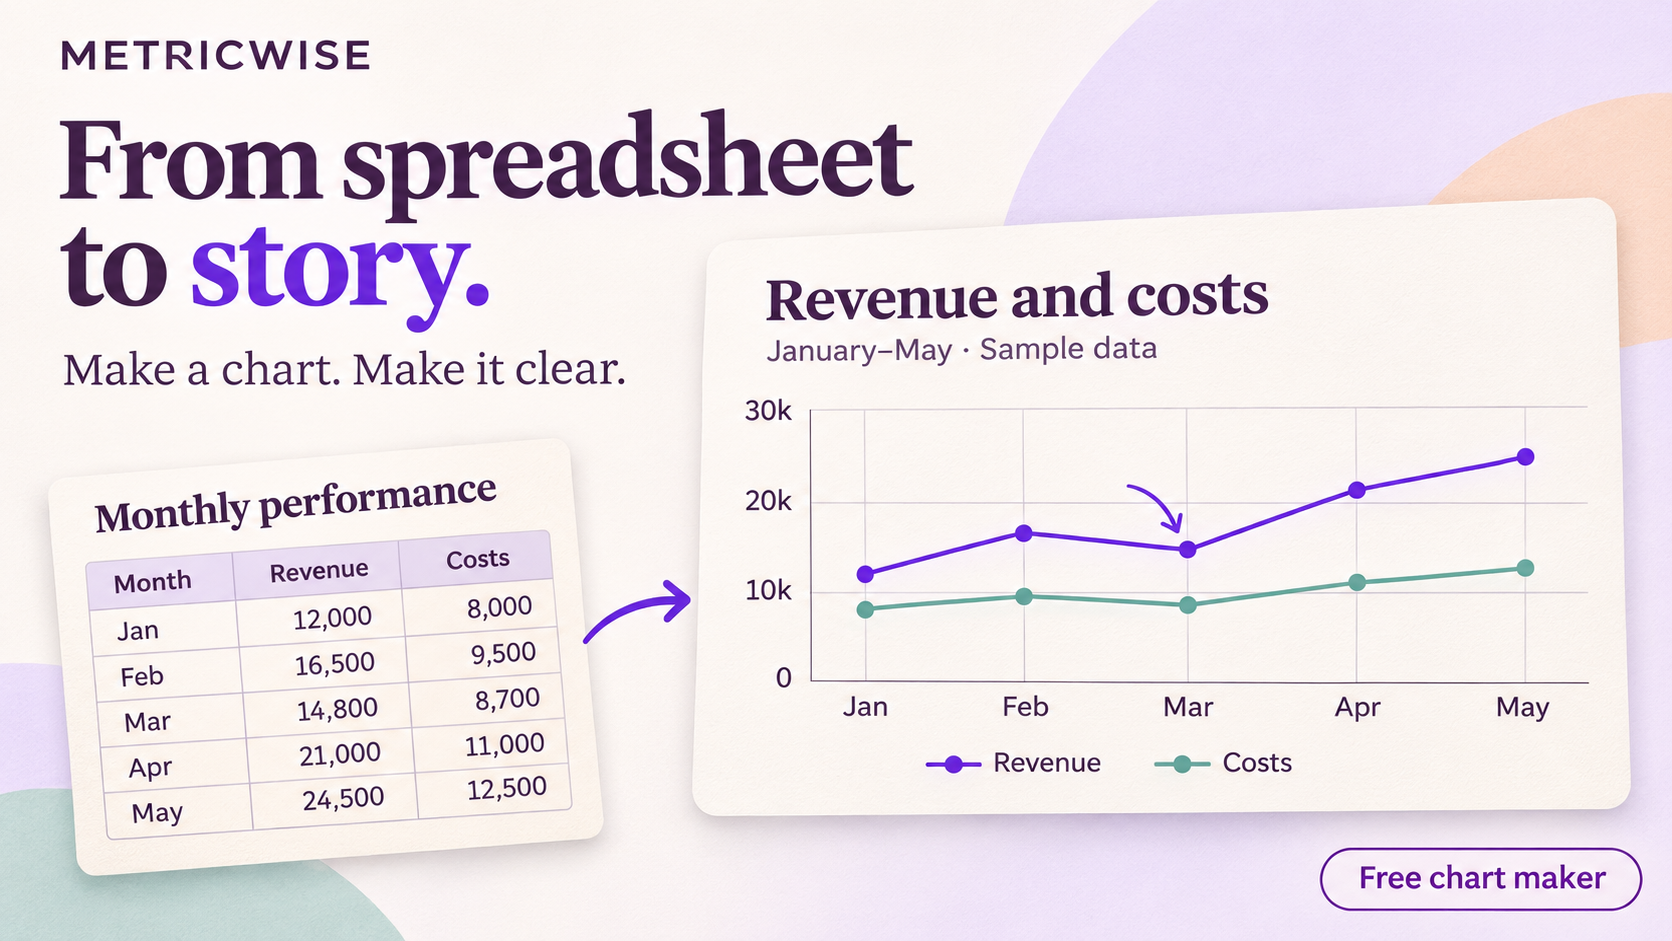
For this walkthrough, we’ll use an illustrative table of monthly revenue and costs:
| Month | Revenue | Costs |
|---|---|---|
| January | 12000 | 8000 |
| February | 16500 | 9500 |
| March | 14800 | 8700 |
| April | 21000 | 11000 |
| May | 24500 | 12500 |
Our question is: How did revenue and costs change from January to May?
A line chart lets readers follow both trends across the same period.
1. Paste your spreadsheet data into Chart Maker
Open the chart editor and select Paste Data.

Copy the relevant cells from your spreadsheet, including the header row. Metricwise supports pasted tables from Excel, Google Sheets and Numbers, as well as CSV text and tab-separated data.
You can also select Start a blank table to enter values directly, or Try sample data to explore the editor before using your own numbers.
For a clean starting point:
- Give each column a descriptive heading.
- Keep each column consistent: dates, categories or numeric values.
- Exclude totals and subtotals unless you want to plot them.
- Use comparable units across the values you intend to compare.
For our example, copy all three columns, from Month through Costs, including the headings.
Check how your columns were interpreted
Open Column Settings to review the detected column types. Available types include text, number, currency, percent and date.
You can also choose how numbers and dates should be interpreted. This helps when your source uses decimal commas or when a date such as 04/05/2026 could mean different things depending on the date convention.
If a value cannot be converted, the editor flags the issue and shows it as a gap. Correct the value or its interpretation before exporting.
2. Choose the right chart type

Metricwise Chart Maker offers eight chart types:
| Chart type | Use it to… |
|---|---|
| Bar | Compare values across categories |
| Stacked bar | Compare totals and their components |
| Line | Follow changes over time |
| Area | Emphasise the magnitude of a trend |
| Pie / donut | Show a small set of shares within one whole |
| Scatter | Explore the relationship between two numeric variables |
| Funnel | Compare counts across ordered stages |
| Metric | Highlight one headline number |
The editor also suggests charts based on your data. Use those suggestions as a starting point, then choose the format that best answers your question.
For our monthly example, select Line. Choose Month as the category or X-axis, then select Revenue and Costs as the value columns.
Keep January through May in chronological order so the lines tell the story correctly.
3. Decide whether to show individual rows or summarise values
Some tables already contain the values you want to display. Others need to be summarised.
Under Summarize values, you can keep each row or apply a sum, average, count of numeric values, minimum or maximum.
For our example, each month already has one revenue value and one cost value. Choose None — keep each row.
If your source instead contains multiple sales records for each product, choosing Sum lets you compare total sales by product.
Check this setting carefully. An average order value and total order revenue answer different questions, even when they come from the same table.
4. Customise the chart so readers understand it
Once the chart shows the correct data, refine its presentation.
Start in Basic mode and work through Chart Options, Layout & Style, and Image Settings.
Give your chart a title that names the measure and period. For this example, “Monthly revenue and costs, January–May” gives readers useful context immediately.
Then check the details:
- Use distinct, readable colours for the two series.
- Make sure the legend identifies revenue and costs.
- Apply the appropriate number format and currency.
- Keep labels large enough for the final slide or document.
- Remove visual details that distract from the comparison.
A chart needs to work at the size people will actually see it. A label that looks readable in the editor may become too small when the image is placed beside other content.
5. Add annotations and branding in Advanced mode
Switch to Advanced mode when your chart needs more context or a specific layout.
You can arrange the chart with text, rectangles, ellipses, arrows and an uploaded logo. This gives you space to add a source note, explain an unusual result, or highlight a value worth discussing.
For our example, you might add an arrow pointing to March’s revenue dip. Include an explanation only if you have evidence for it. The chart shows the change; understanding its cause requires additional context.
You can also adjust the canvas dimensions and background, including a transparent background, to suit the document or presentation where the chart will appear.
6. Download your chart as a PNG
When the chart is ready, select Download PNG.
The exported image includes your composition, including any text, annotations and logo you added. Image Settings offers 1× and 2× PNG resolution options.
Before downloading, check that:
- The plotted values match your source.
- The title, units and time period are clear.
- Labels remain readable at the intended display size.
- Annotations accurately describe the data.
You can then insert the PNG into a presentation, report, document or blog post.
Download your image or save your chart before leaving the editor. Refreshing or leaving the public editor clears unsaved work.
Frequently asked questions
Can I create a chart online without signing up?
Yes. Metricwise Chart Maker lets you enter or paste data, use Basic and Advanced editing, and download a PNG without an account. Signing in is required to save a chart to your workspace.
Can I make a chart from Excel or Google Sheets?
Yes. Copy your table, including the header row, and use Paste Data in the editor. You can review column types and edit values after pasting.
Can I edit the data inside Chart Maker?
Yes. The editor includes a spreadsheet where you can enter and change values, work with formulas, and review column settings.
Can I save my chart and edit it later?
Yes. Select Save and sign in to save the chart to your workspace. The free Starter plan includes up to three saved charts.
Can I use Chart Maker for connected dashboards?
Chart Maker creates standalone charts from table data. For warehouse connections, shared dashboards and reusable metric definitions, explore Metricwise BI.
Create your first chart
Start with one question and the table that answers it. Choose a suitable chart, check the values, and add the context your readers need.
Create a chart with Metricwise and download your PNG without an account.
Turn your data into trusted answers
Build governed metrics, explore your data, and create dashboards with Metricwise.
Get StartedPut it into practice
Build the skill behind the idea, or try it with your own data.