Data Academy
Learn Data Skills Online: Where to Start with Metricwise Academy
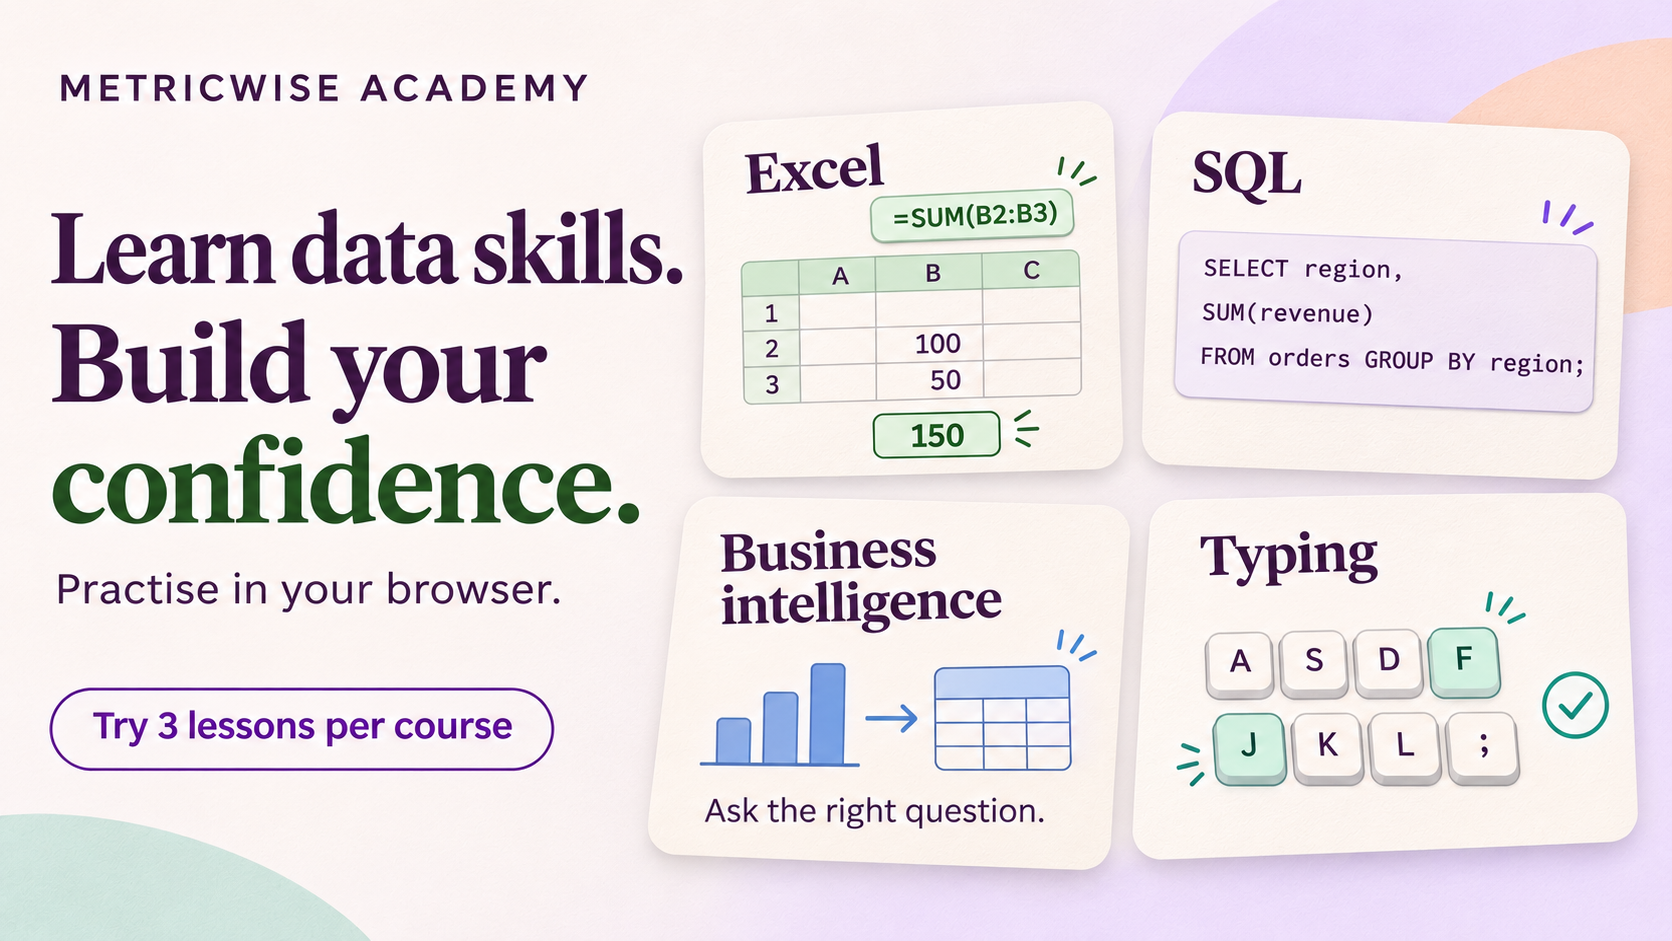
You want to feel more confident working with data. Perhaps you need to fix a spreadsheet, understand a dashboard or write your first SQL query. The challenge is knowing where to begin.
Metricwise Academy helps you learn data skills online through structured courses and interactive exercises. Choose Excel, SQL, business intelligence or typing, then practise in your browser using the provided examples.
Each course includes three preview lessons you can try without an account. You can explore the exercises, check your work and decide which learning path fits your goals.
Here’s what each course covers and how to choose your starting point.
1. Choose the data skill that matches your goal
Start with a task you want to handle more confidently.
If your daily work involves spreadsheets, Excel is a useful first step. If you need to retrieve information from database tables, start with SQL. If you want to understand how metrics and dashboards are built, choose business intelligence.
Typing provides a separate path for building accuracy and confidence at the keyboard.
| Your goal | Start with |
|---|---|
| Work more confidently with spreadsheets and formulas | Excel |
| Find answers in database tables | SQL |
| Understand metrics, reporting and chart choices | Business intelligence |
| Improve keyboard accuracy and rhythm | Typing |
There is no required order between courses. You can focus on one subject or switch when another becomes relevant to your work.
2. Learn Excel through interactive spreadsheet exercises

A spreadsheet becomes easier to work with when you understand how to navigate it, select the right cells and build formulas you can check.
The interactive Excel course starts with those foundations. Your first three lessons are:
- Your first worksheet
- Meet your shortcut keys
- Move with the keyboard
Practice takes place in an embedded worksheet, so you can try the preview without installing Microsoft Excel.
The wider curriculum moves into formulas, summaries, conditional calculations, text cleanup, lookups and dates. You’ll encounter functions such as SUM, IF, COUNTIF, SUMIFS and XLOOKUP, alongside exercises that help you use them in context.
These skills apply to familiar tasks: calculating a budget total, counting records that meet a condition, cleaning inconsistent labels or retrieving information from a related table.
The course also includes applied projects covering property operations, hospital administration and sales reporting.
Start here if: you use spreadsheets regularly but want more confidence in how your worksheets work.
3. Learn SQL by writing and running queries

SQL helps you turn a business question into a request for specific data.
The SQL course with interactive exercises begins with reading tables and selecting columns. The preview introduces:
- What is SQL?
- Read columns, types, and keys
- Select the columns you need
You write and run queries against the supplied practice data. You can inspect the results and use exercise feedback to refine your answer.
You don’t need to connect your own database to begin.
As you progress, the curriculum covers filtering, grouping, joins, common table expressions and window functions. It also addresses a practical problem that can be easy to miss: combining tables without double-counting records.
For example, joining an orders table to an order-items table can produce several rows for one order. Understanding that relationship helps you recognise when a total may have been repeated.
Start here if: you want to retrieve, filter and summarise information from database tables.
4. Understand the reasoning behind dashboards with BI

A chart can look convincing while answering the wrong question. Before designing a visual, you need to understand what the underlying records represent.
The business intelligence course starts with that reasoning. Its first three lessons are:
- What does one row represent?
- Sort dimensions and measures
- Choose count or sum
These concepts influence almost every reporting decision.
Consider an illustrative table containing three orders:
| Order | Region | Revenue |
|---|---|---|
| A | North | £100 |
| B | North | £50 |
| C | South | £75 |
Counting orders tells you there are three. Summing revenue gives you £225. Grouping revenue by region gives you £150 for North and £75 for South.
Each answer is valid, but each answers a different question.
The BI curriculum builds on these foundations with choosing appropriate tables, selecting clear visuals, defining shared measures and keeping useful filter columns. Applied projects explore marketing channels, monthly KPIs and conversion stages.
You can take the course without connecting a warehouse or bringing a company dataset.
Start here if: you want to understand, check or explain the numbers in a report.
5. Build keyboard confidence with focused typing practice
Working with spreadsheets and queries also means spending time at a keyboard.
The typing course provides focused drills that begin with finger placement and home-row keys. The preview lessons are:
- Find F and J
- Reach D and K
- Reach S and L
Every drill within those preview lessons is included.
The curriculum gradually introduces more keys, words, capitals, punctuation and numbers. Feedback on speed and accuracy helps you decide what to practise again.
Begin at a pace where you can place your fingers comfortably and type accurately. Use a physical keyboard for the intended practice experience.
Start here if: you want to build a steadier keyboard routine for writing, data entry or composing queries.
6. Use feedback to guide your next attempt
Academy lessons give you a task to work through, with feedback appropriate to the exercise.
Depending on the task, you can check a result, review a hint or compare your reasoning with a model answer. Typing drills provide scoring feedback.
A useful practice routine is to:
- Read the task and identify what a correct result should show.
- Try it yourself.
- Review the feedback or hint.
- Make a specific correction.
- Repeat the task until you can explain your approach.
For a formula, that might mean checking the selected range. For SQL, it might mean inspecting which rows your filter includes. For BI, it might mean revisiting whether the question calls for a count or a sum.
Use the feedback to understand the result before moving forward.
What can you learn for free?
The first three lessons in the first module of each course are available without signing in.
After signing in, the free Starter plan includes free Academy modules. Pro, Team and Enterprise include full Academy access. You can review the current options on the pricing page.
Preview progress is stored in your current browser when local storage is available. Use the lesson’s sign-in flow on the same browser and device to carry your preview work into the app.
Frequently asked questions
Is Metricwise Academy suitable for beginners?
Yes. Each course starts with foundations, such as navigating a worksheet, reading a database table, understanding a row or finding home-row keys.
Do I need to install software?
The preview exercises run in your browser using the provided practice data. A desktop or laptop gives you more space for worksheet and query exercises. Typing drills are designed for a physical keyboard.
Should I learn Excel or SQL first?
Choose Excel if your immediate tasks involve spreadsheets and formulas. Choose SQL if you want to retrieve and summarise data from database tables. You can start either course without completing the other.
Is the BI course the same as Metricwise BI?
The Academy course teaches business intelligence concepts. Metricwise BI is the analytics product for connected data, shared metrics and dashboards.
Start with one lesson
Choose the skill that helps with the work in front of you. Open a preview lesson, try the exercises and use the feedback to guide your next attempt.
Explore Metricwise Academy and try three lessons from your chosen course without an account.
Turn your data into trusted answers
Build governed metrics, explore your data, and create dashboards with Metricwise.
Get StartedPut it into practice
Build the skill behind the idea, or try it with your own data.