Data Academy
Databricks vs Snowflake for BI in 2026: Differences, Use Cases and How to Choose
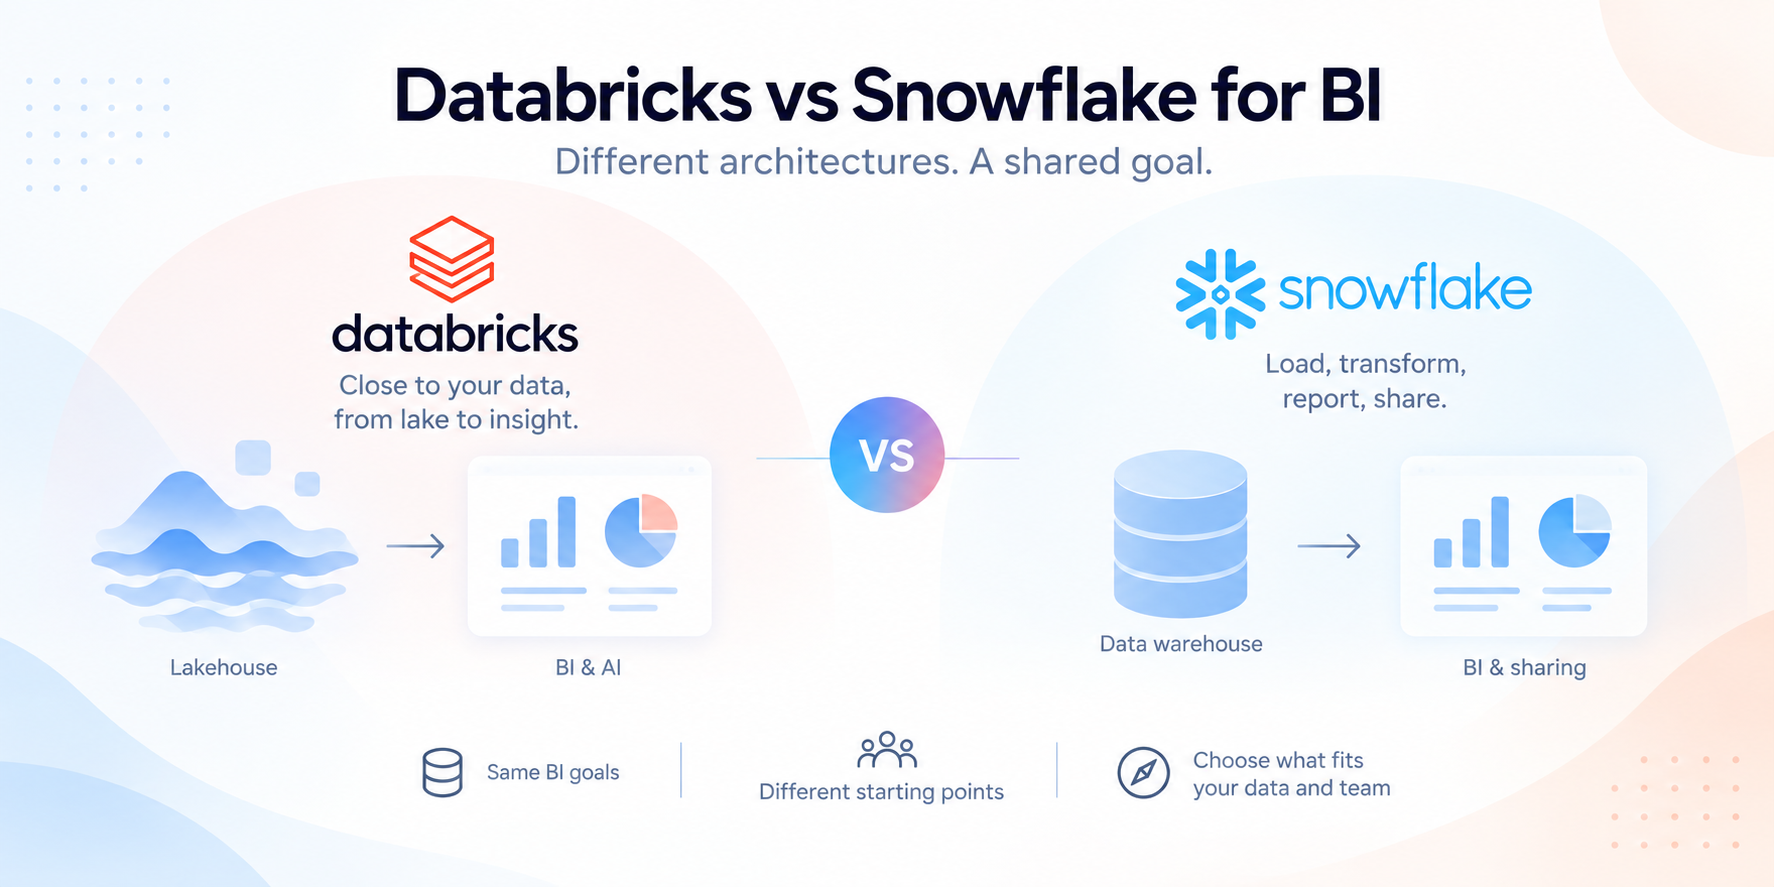
Databricks vs Snowflake for BI: How to Choose
The usual comparison between Databricks and Snowflake is out of date. Snowflake is no longer limited to SQL warehousing, while Databricks now offers SQL analytics, dashboards, metrics and conversational tools alongside its engineering and machine-learning products.
Both can sit beneath dashboards, govern access and let users question data in natural language. The useful question is not which platform has more BI features. It is which one fits where your data lives, how your teams work and who maintains the definitions behind every report.
Databricks and Snowflake now compete for the same BI workloads
Research on cloud data environments places both platforms among those used for scalable analytics pipelines. They share practical concerns such as latency, orchestration, data quality, governance and cost ([Khemka and Jain, 2025](https://doi.org/10.63345/jqst.v2i2.286)). Their starting points, however, remain different.
Databricks SQL is built on its lakehouse architecture and queries lake data directly. Its documented capabilities include ANSI SQL, dashboards, metric views, alerts, materialised views, streaming tables, APIs and connections to external BI tools ([Databricks documentation](https://docs.databricks.com/aws/en/sql)).
Snowflake commonly sits at the centre of a more familiar reporting model: data is loaded and prepared in the platform, then served through SQL and external BI tools. Tapestry, for example, built a self-service analytics product on Snowflake with Tableau as its user interface ([Snowflake customer case study](https://www.snowflake.com/en/customers/all-customers/case-study/tapestry/)).
This distinction matters more than a feature checklist. Databricks is a natural candidate when reporting needs to stay close to lakehouse pipelines, streaming data or machine-learning work. Snowflake is often the easier fit when SQL reporting, controlled data sharing and established BI applications already shape the data estate.
How business intelligence works on Databricks
Databricks supports both native and external BI workflows. Analysts can work in Databricks SQL or connect another BI tool. Business users can view low-code dashboards or ask questions through Genie Agents. Unity Catalog supplies shared semantics, permissions and governance ([Databricks AI/BI documentation](https://docs.databricks.com/gcp/en/ai-bi)).
The attraction is that data preparation and consumption can remain in the same wider environment. A team might create a streaming table, define a governed metric and publish it through a dashboard without first moving the data into a separate warehouse.
That does not remove the difficult work behind BI. Consider the question, “Which regions lost active customers last quarter?” Someone must still define an active customer, choose the relevant date and decide how to handle returns, merged accounts and regional changes. A conversational interface makes an approved definition easier to use. It cannot settle an unresolved business argument.
The work also shifts. Analysts may write fewer routine queries but spend more time testing answers and maintaining definitions. Platform teams must support workloads with very different consequences. A delayed model-training job is inconvenient. A slow finance dashboard at month end can hold up reporting.
Databricks is extending this approach across structured and unstructured information through Genie One, Genie Agents and Genie Ontology ([TechTarget](https://www.techtarget.com/data-technologies/news/366644813/Databricks-intros-new-Genie-data-management-tools-to-aid-AI)). These products show its direction, but recent launches are not evidence of mature adoption in every organisation.
How Snowflake fits established BI workflows
Snowflake’s appeal often starts with an operating model that BI teams already understand. Data is loaded into the platform, transformed into analytical structures and queried through SQL or connected tools. Business users can keep working in familiar applications while data teams manage preparation and access centrally.
Tapestry reports processing more than four billion rows a day and doubling its data sources while cutting costs compared with its former Hadoop platform. It also says that partner data-sharing setup fell from six to eight weeks involving 10 to 15 people to less than half a day, followed by validation ([Snowflake customer case study](https://www.snowflake.com/en/customers/all-customers/case-study/tapestry/)). These are self-reported results from a vendor case study, and the comparison is with legacy Hadoop rather than Databricks. They illustrate a Snowflake workflow, not a general performance or cost advantage.
Snowflake is also pushing beyond dashboards. Snowflake Intelligence is presented as a conversational work agent that can answer questions across company data and act through governed integrations with applications such as Slack, Salesforce and Jira ([Snowflake product announcement](https://www.snowflake.com/en/blog/snowflake-intelligence-work-agent)). The announcement described some integrations as forthcoming and did not independently assess answer quality, safety or deployment effort.
This changes the risk as well as the interface. If an agent can act on an answer, a vague definition of “overdue account” may affect a workflow outside the analytics platform. Identity controls, approval rules and clear business definitions become more important, not less.
Conversational BI still depends on clear definitions
Databricks and Snowflake now overlap across most of the BI workflow: preparing data, running SQL, serving dashboards, controlling access and supporting natural-language analysis.
This is why feature comparisons often end in a draw. Both vendors can offer SQL, governance, integrations and AI-assisted tools. That tells you little about the work required to make them dependable with your data.
Research into queryless analytics suggests that natural-language interfaces can widen access to data and change how business users work with data teams. It also identifies contextual understanding and complex query optimisation as continuing problems ([Parimi, 2025](https://doi.org/10.32628/cseit251112390)).
Natural language is the easy part of a product demonstration. Organisational language is harder. Revenue might mean gross or net revenue. “This quarter” could refer to a calendar or financial quarter. Customer counts might include trial users, duplicates or refunded orders. Neither platform can infer the intended definition reliably if the organisation has never agreed on one.
What should decide between Databricks and Snowflake
Start with where the work already happens
Databricks deserves closer evaluation when engineering, streaming, machine learning and reporting already meet in a lakehouse. Keeping BI close to those pipelines may reduce data movement and duplicate modelling.
Snowflake deserves closer evaluation when SQL analytics, governed sharing and external BI tools already form the centre of reporting. Replacing that model requires a better reason than feature parity. Existing transformations, permissions, skills and support processes are part of the architecture too.
That does not mean choosing whatever is already installed. It means counting migration and organisational change as real costs.
Compare responsibility alongside price
Published evidence does not support a universal cost winner. The result depends on storage, compute behaviour, concurrency, workload design, commercial terms and the people needed to run the system.
Ask who owns each layer after launch. If a dashboard shows the wrong total, does the BI developer inspect the report, the analytics engineer check a transformation or the platform team review an agent’s context? A workable design gives users a clear route from a suspect number to the person who can fix it.
Test the complete BI journey
Do not evaluate either platform using query speed alone. Follow a business question from source data to decision. Test how long it takes to prepare the data, agree a metric, apply permissions, publish the result and trace an unexpected figure back through its transformations.
Use representative workloads: a frequently refreshed executive dashboard, a detailed exploratory query, concurrent users and at least one awkward business definition. If conversational analysis matters, try paraphrases and ambiguous terms. Include questions the system should refuse because the user lacks access.
A fast demonstration query is easy to produce. The harder test is whether an analyst can explain Monday morning’s finance figure, correct it safely and stop the same mistake reaching every dashboard or agent that uses the definition.
Databricks and Snowflake are becoming more alike at the interface. The lasting difference sits underneath it: where data is prepared, where business definitions live, how permissions follow users and who is responsible when a simple answer turns out to be wrong.
Turn your data into trusted answers
Build governed metrics, explore your data, and create dashboards with Metricwise.
Get Started